 |
Products and services designed to enhance the working environment through hygiene rental equipment, consumables, laundries, indoor plants, drinking water, water coolers and specialised clothing. |
Alan Fainman
Chief executive |
Revenue
R1,7 billion
9,7% increase
Trading profit
R325,9 million
16,3% increase
|
|
 |
Financial indicators
(for the year ended June 30) |
2011
R’m |
2010
R’m |
| Revenue |
1 730,1 |
1 576,4 |
| Trading profit |
325,9 |
280,2 |
| Operating assets |
780,9 |
833,9 |
| Operating liabilities |
202,3 |
214,2 |
| Depreciation |
149,2 |
135,0 |
| Amortisation and impairments of intangible assets |
1,5 |
3,6 |
| Goodwill and intangible assets |
52,7 |
53,2 |
 |
|
|
| Sustainable development indicator overview |
|
|
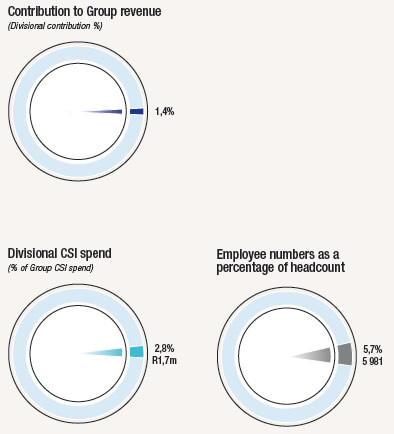
| Employees |
5 981 |
5 414 |
| Total training spend (R’000) |
4 475 |
2 600 |
| Training spend per employee (R) |
748 |
480 |
| Employees attending HIV/Aids training (%) |
14,0 |
25,5 |
| Lost-time injury frequency rate |
2,2 |
0,4 |
| Work-related fatalities (number) |
– |
– |
| CSI spend (R’000) |
1 652 |
1 746 |
| Total water usage (litres ’000) |
639 184 |
686 250 |
| Total electricity usage (including electricity from renewable sources) (kWh ’000) |
10 157 |
11 685 |
| Petrol (litres) |
1 318 313 |
1 127 821 |
| Diesel and biofuel (litres) |
2 148 990 |
1 778 878 |
| Total carbon emissions (tonnes) |
52 204 |
58 683 |
| Carbon emissions per employee (tonnes) |
8,7 |
10,8 |
QUICK LINK: Operational report
Material issues
- Reducing our consumption of water and electricity
- Improving employment equity and skills development
- Offering improved adult basic education and training to staff
- Ensuring the safety of our drivers
- Operating successfully in difficult economic conditions
- Maintaining our reputation as an industry leader
|
|