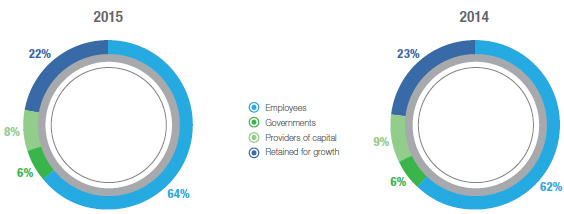
Value added statement
“Value added” is the value which the Group has added to purchased materials and goods by process of manufacture and conversion, and the sale
of its products and services. This statement shows how the value so added has been distributed.
| |
2015 |
|
|
2014 |
|
|
|
|
|
|
|
|
| |
|
|
R’000 |
|
|
% |
|
| |
|
|
|
|
|
|
|
|
|
|
|
| Turnover |
204 915 925 |
|
|
|
|
|
183 645 179 |
|
|
|
|
| Net cost of raw materials, goods and services |
(165 161 294) |
|
|
|
|
|
(149 365 987) |
|
|
|
|
| Wealth created by trading operations |
39 754 631 |
|
|
|
|
|
34 279 192 |
|
|
|
|
| Finance income |
335 272 |
|
|
|
|
|
279 038 |
|
|
|
|
| Dividend income |
127 429 |
|
|
|
|
|
112 579 |
|
|
|
|
| Total wealth created |
40 217 332 |
|
|
100,0 |
|
|
34 670 809 |
|
|
100,0 |
|
| Distributed as follows |
|
|
|
|
|
|
|
|
|
|
|
| Employees |
|
|
|
|
|
|
|
|
|
|
|
| Benefits and remuneration |
25 591 811 |
|
|
63,6 |
|
|
21 435 548 |
|
|
61,8 |
|
| Governments |
|
|
|
|
|
|
|
|
|
|
|
| Taxation |
2 276 038 |
|
|
5,7 |
|
|
2 107 173 |
|
|
6,1 |
|
| Providers of capital |
3 279 989 |
|
|
8,2 |
|
|
3 091 534 |
|
|
8,9 |
|
| Finance charges |
1 324 183 |
|
|
3,3 |
|
|
1 218 242 |
|
|
3,5 |
|
| Distributions to shareholders |
1 955 806 |
|
|
4,9 |
|
|
1 873 292 |
|
|
5,4 |
|
| Retained for growth |
9 069 494 |
|
|
22,5 |
|
|
8 036 554 |
|
|
23,2 |
|
| Depreciation and amortisation |
2 539 848 |
|
|
6,3 |
|
|
2 344 920 |
|
|
6,8 |
|
| Impairments |
631 240 |
|
|
1,6 |
|
|
1 088 327 |
|
|
3,1 |
|
| Profit for the year attributable to shareholders of the Company |
5 898 406 |
|
|
14,6 |
|
|
4 603 307 |
|
|
13,3 |
|
|
|
|
|
|
|
|
|
|
|
|
|
| |
40 217 332 |
|
|
100,0 |
|
|
34 670 809 |
|
|
100,0 |
|