Value added statementFOR THE YEAR ENDED 30 JUNE
"Value added" is the value which the Group has added to purchased materials and goods by process of manufacture and conversion, and the sale of its products and services. This statement shows how the value so added has been distributed.
| R'000s |
2020 |
% |
| Revenue |
87 881 064 |
|
75 953 538 |
|
| Net cost of raw materials, goods and services |
(49 537 041) |
|
(44 056 927) |
|
| Wealth created by trading operations |
38 344 023 |
|
31 896 611 |
|
| Impairments |
(410 033) |
|
(1 955 261) |
|
| Finance income |
491 109 |
|
669 296 |
|
| Dividend income |
42 280 |
|
39 166 |
|
| Total wealth created |
38 467 379 |
100.0 |
30 649 812 |
100.0 |
| Distributed as follows |
|
|
|
|
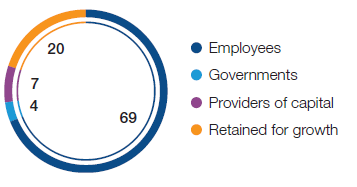
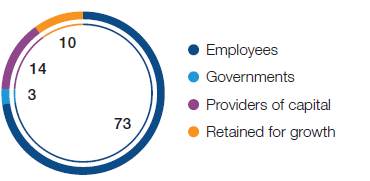
| Employees |
|
|
|
|
| |
Benefits and remuneration |
26 455 525 |
68.8 |
22 510 592 |
73.4 |
| Governments |
|
|
|
|
| |
Taxation |
1 670 774 |
4.3 |
851 589 |
2.8 |
| Providers of capital |
2 860 805 |
7.4 |
4 170 954 |
13.6 |
| |
Finance charges |
1 792 071 |
4.7 |
1 903 390 |
6.2 |
| |
Distributions to shareholders |
1 068 734 |
2.8 |
2 267 564 |
7.4 |
| Retained for growth |
7 480 275 |
19.4 |
3 116 677 |
10.2 |
| |
Depreciation and amortisation |
3 639 342 |
9.5 |
2 947 696 |
9.6 |
| |
Profit for the year attributable to shareholders of the Company from continuing operations |
3 840 933 |
10.0 |
168 981 |
0.6 |
| |
38 467 379 |
100.0 |
30 649 812 |
100.0 |
Value added 2021 (%)
Value added 2020 (%)
Exchanges with governments (including amounts collected on their behalf):*
| |
South African |
International |
| R'000s |
2021 |
2020 |
2021 |
2020 |
| Employee taxes |
2 120 016 |
2 330 239 |
2 612 605 |
1 426 488 |
| Company taxes |
1 464 070 |
770 611 |
206 704 |
80 978 |
| Value added tax and sales tax |
19 379 516 |
21 687 179 |
3 205 416 |
1 145 891 |
| Customs and excise duty |
3 701 436 |
4 729 552 |
120 352 |
92 455 |
| Other |
227 212 |
207 097 |
49 015 |
29 339 |
| |
26 892 250 |
29 724 678 |
6 194 092 |
2 775 151 |


